Keep your OT running, reliable, and safe — without burning your best engineers on it.
Five things we take off your plate, turn into a number your CFO will fund, and do on top of the tools you already own.
“What value is created by having our staff patch infrastructure and run refreshes? Important — yes. Valuable — not a chance.”
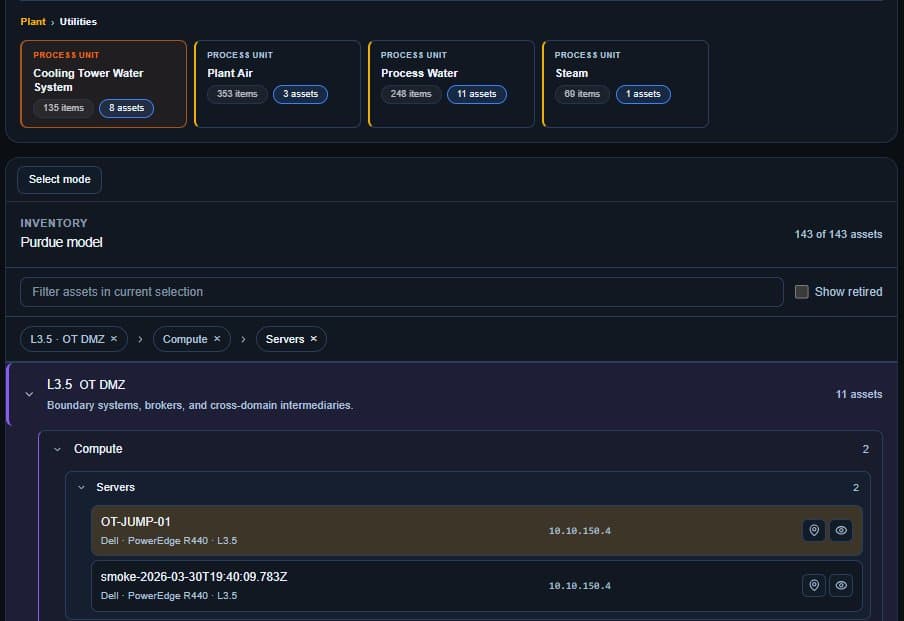
Patching and refreshes, off your plate — and never falling through the cracks.
It's the work every plant knows it should stay on top of, and the work that quietly slips when one person tracks it by hand across a fleet. We own it. Every managed asset carries a full patch and firmware history. Vendor advisories and end-of-service notices land against the equipment you actually run — so nothing ages out in a window you can't afford.
- A complete history per asset — version, outcome, approval, and ticket, recorded automatically.
- End-of-life that's planned, not discovered — vendor end-of-service and warranty dates tracked against your installed base.
- 151 failure modes across 7 component classes — the things that fail quietly, watched on a cadence.
“I don't even know what I have — or what it's going to take to sustain and replace it. I need a 10-year budget forecast. Help me.”
The OT budget your CFO keeps asking for — built on your real assets.
Most teams can't build a multi-year OT capital plan they can actually defend. The data lives in spreadsheets and people's heads, and every replacement becomes a surprise capital ask. We turn your asset base into a forecast: a flat, predictable operating cost year over year, with capital replacements appearing only where you decide they belong — each one a deliberate call tied to risk, not a timer.
- OPEX flat, CAPEX deliberate — a forecast you can plan around, not a black hole of emergency requests.
- Replace-or-keep at the equipment level — every aging asset scheduled to the window that makes sense.
- Risk reduction per dollar — work ranked by how much risk each dollar retires, so the plan defends itself.
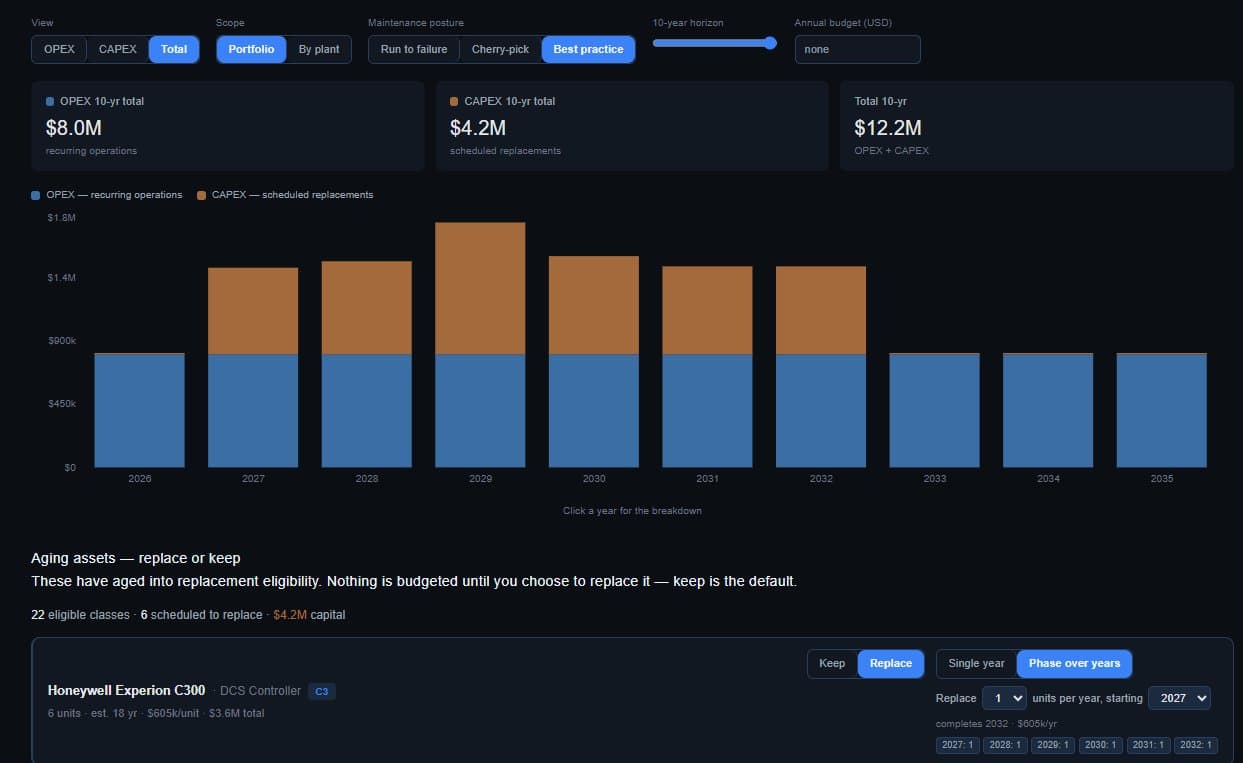
Illustrative — sample data.
“I want to know the dollars at risk from every threat we identify.”
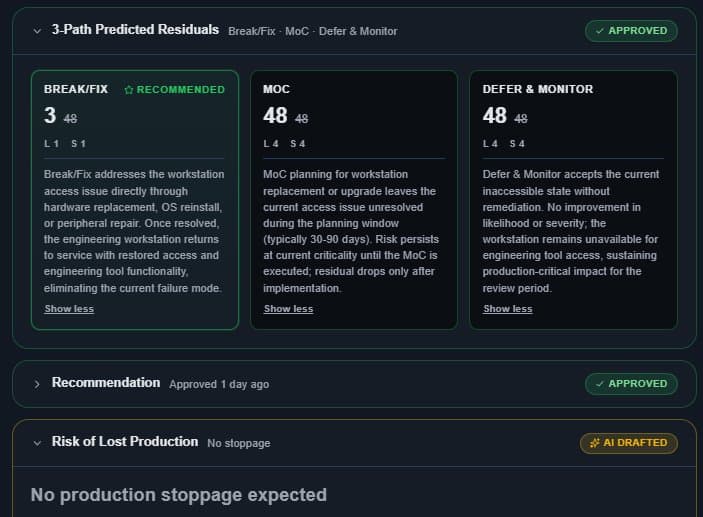
Every risk, in the one unit leadership funds: dollars.
A criticality score tells your engineers where to look. It doesn't move a budget meeting. OT Continuum scores every signal the way OT risk actually works — likelihood and severity, weighted by where the asset sits and how critical it is to production — then translates that into the production and dollars it puts at risk. The same flaw on a safety controller and a back-office server stop looking alike, because they aren't.
- OT-native scoring, not generic CVSS — weighted by Purdue level and equipment criticality, 0–500.
- Risk translated to production impact — each signal tied to the equipment and output it threatens.
- The language of the budget — risk expressed in dollars, so the funding case makes itself.
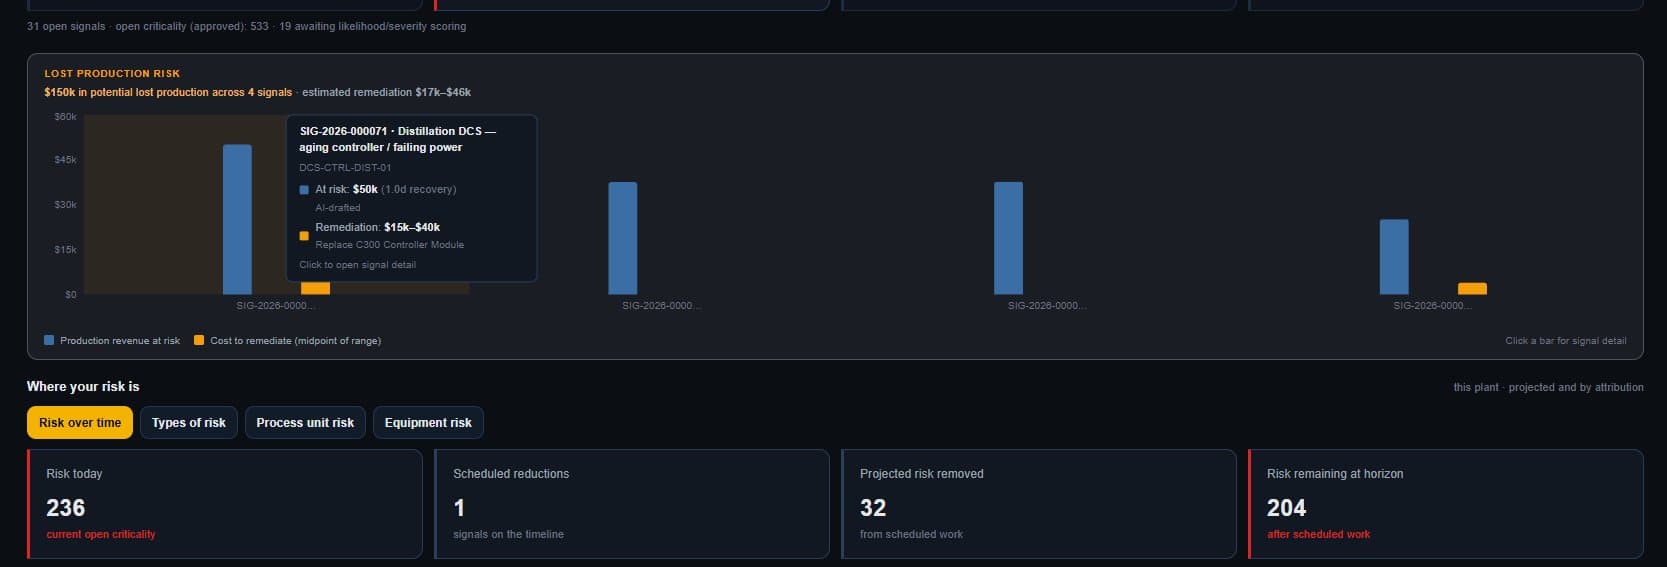
Illustrative — sample data.
Risk translated to production impact — every signal with a dollar figure.
Illustrative — sample data.
“If it's yet another tool we have to log into, it won't get adopted.”
Already running Dragos, Claroty, Nozomi or SolarWinds? We make their output count.
Your monitoring stack is good at finding things. It was never built to decide what matters, line up the work, and get it done. That's the gap we fill. Bring in what your tools produce — import their findings, forward their alerts to one inbox — and OT Continuum turns that stream into triaged, prioritized, executed work tied to the production it affects. You don't rip anything out, and you don't log into one more thing all day.
- Bring their findings in — import asset and finding exports, with AI that maps the columns for you.
- Forward your alerts to one inbox — scattered alerts become classified, routed signals automatically.
- The connective tissue — between what your tools flag and the production it puts at risk.
“If it's 15 minutes, let's swing. If it's 3 months, maybe next year.”
No 18-month rollout. Three inputs, and you're live.
The fear with anything new in OT is the implementation — the year-long project, the army of consultants, the change-management slog. This isn't that. We need three things, and your team already has all of them. Upload the lists, the AI maps the columns, and your plant model and first signals are live. Prove it on your own floor before you commit to anything.
- A historian export + your asset lists — drop them in; AI-assisted mapping builds the plant model.
- Forward your alerts — point your alert emails at one monitored inbox; setup is self-serve.
- A 30–60 day trial on your real plant — see the value on your own assets before any contract.
The data you already pull — we map it for you.
CSV, spreadsheet, inventory tool export — AI handles the columns.
Self-serve setup; alerts become routed signals.
Keep your OT running, reliable, and safe — without burning your best engineers on the work that doesn't deserve them.
We take the boring, important sustainment off their plate, turn risk into dollars your CFO will fund, and do it on top of the tools you already own. Productized, so it scales where a spreadsheet can't.
Book a walkthrough →