Signals in. Context applied. Priorities out. Work done — with proof.
OT Continuum isn't a monitoring tool. It's the decision-and-execution layer that turns scattered OT signals into prioritized, coordinated, documented action across every plant.
One continuous loop, not a one-time project.
Each turn of the loop builds on the last: more context, sharper priorities, less risk, a tighter plan. The compounding is the point.
Inventory & Map
A living model of your plants and OT assets — how systems connect, where risk lives, how failures propagate. Built fast, kept current.
Assess & Triage
Continuously gather OT signals, filter the low-value noise, and route what matters with clear ownership — tied to the equipment and production it threatens.
Patch & Refresh
Coordinate approved patching, refresh, and break/fix across multi-plant environments. Not project-management software — work-coordination built for OT.
Forecast & Plan
Address risk as a portfolio, not one project at a time. A multi-plant, multi-year view that standardizes responses and plans work efficiently across time and teams.
The loop runs across four working modules.
Each is a place your team and ours do real work — not a dashboard tab. Together they hold the whole program in one shared system.
Plants & Assets
A living model of every site, process unit, and asset — Purdue level, criticality, location. Replaces the IP spreadsheets, rack photos, and Purdue drawings scattered across drives.
Monitor & Stabilize
Where signals get triaged, dispositioned, and worked. The remediation engine — three paths, visible stages, ticket sync — fed by your monitoring stack and field reports.
Budgeting & Planning
The 1–10 year OPEX/CAPEX forecast. Replace-or-keep decisions at the equipment level, with risk reduction tied to every dollar. The CFO's view.
Assessments & Programs
Structured assessment campaigns and the programmatic risk portfolio — heat map, aging, and trend — for standardizing posture and building capability across the fleet.
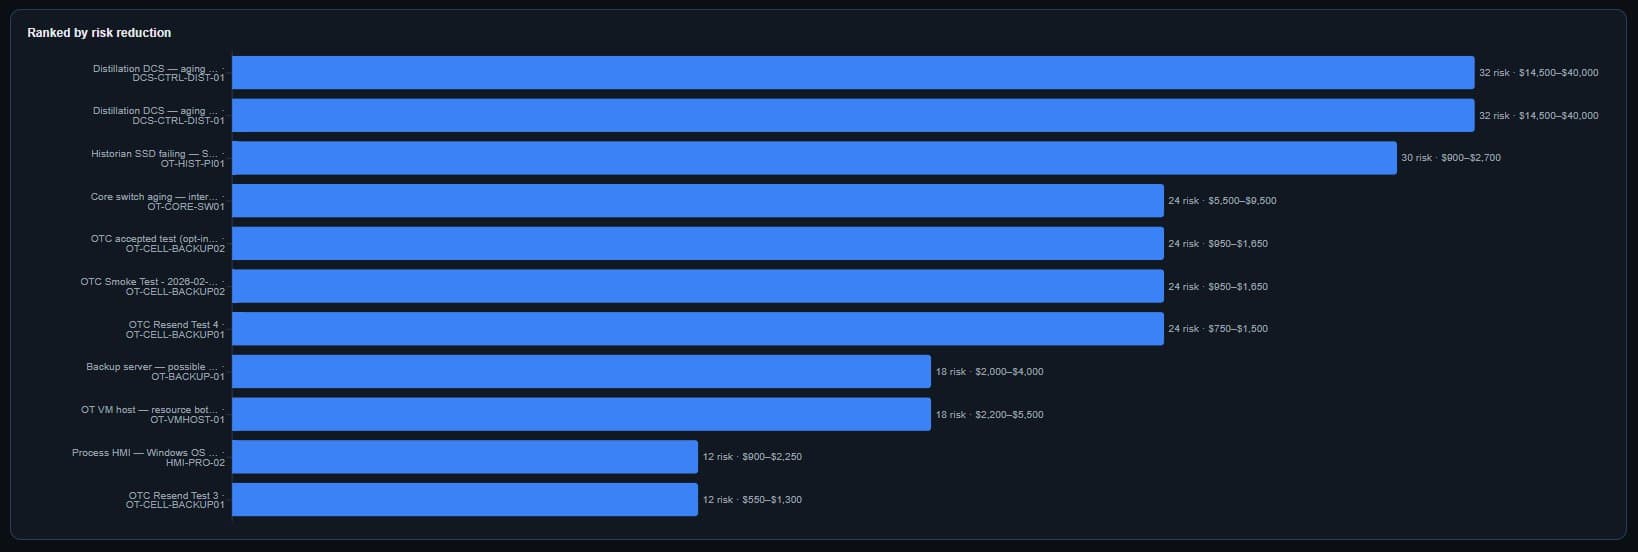
A vulnerability on a safety controller isn't the same as one on a back-office server.
Generic CVSS scores treat them alike. OT Continuum doesn't. Every signal is scored on likelihood and severity, then weighted by the asset's Purdue level and equipment criticality — so the few risks that actually threaten production rise to the top.
That's the difference between a list of 400 findings and a ranked queue of the ten that matter this quarter.
Every signal has a path, an owner, and a visible stage.
When we triage a signal, we recommend one of three paths. You approve or redirect it. Then the work moves through execution — tracked end to end, synced with your ticketing, never ambiguous about where it stands.
Repair or replace the asset.
Schedule a managed change with monitoring.
Document and accept residual risk, review on cadence.
Your team and ours, in the same system — not trading emails.
OT Continuum is a shared portal. Your operations people and our service team work from the same real-time data — killing the coordination overhead of running an OT program through inboxes and spreadsheets.
VP Ops / OT Director
Portfolio health, assessed-risk trends, program review.
CFO / Finance
Budget modeling, OPEX/CAPEX forecast, spend justification.
Plant / Site Manager
Work queue, approval queues, site-level posture.
OT Engineer
Signal detail, evidence, MoC ticket coordination.
See it run on your own assets.
The fastest way to understand the loop is to watch it work on a slice of your real estate. Bring an asset list to the walkthrough.
Book a walkthrough